You know what is selling in your store, but do you know how home products are faring overall? Those smart folks at The NPD Group tallied up their data for last year and the results give a snapshot of the U.S. housewares economy.
Here’s a look at what happened around the home in 2016.
In the kitchen:
- Coffee/espresso is the biggest kitchen appliance category with sales of $1.8 billion in sales.
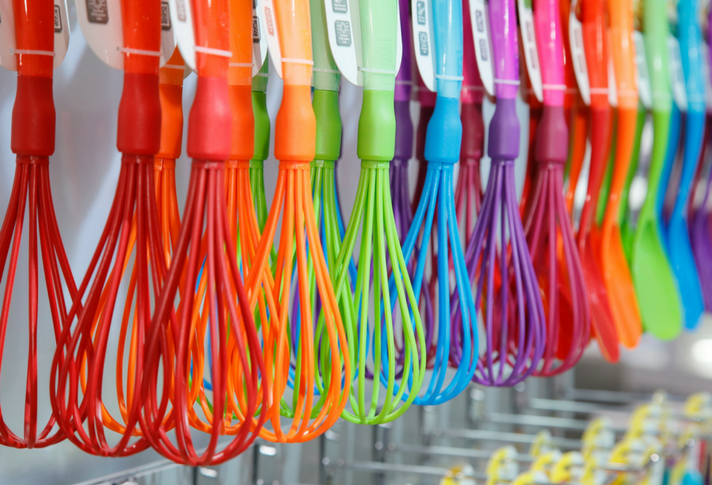
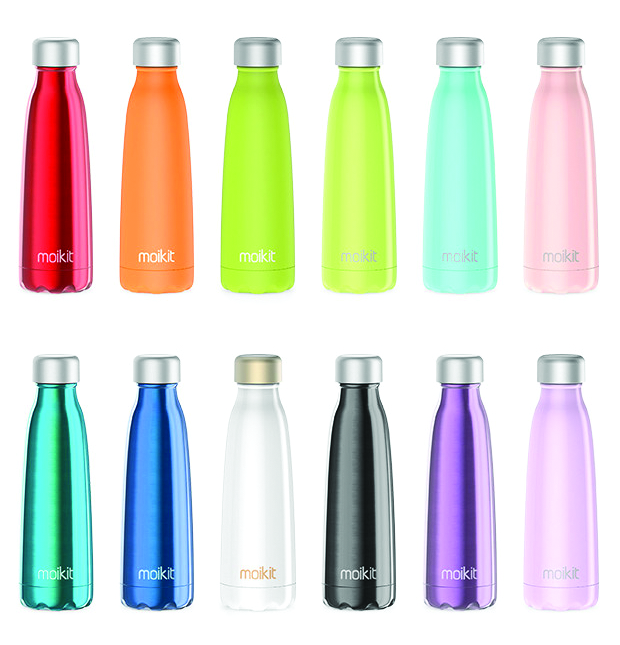
- Portable beverageware was the fastest-growing housewares category in 2016, up by 30 percent from the previous year. The biggest driver of that growth, stainless steel portable beverageware, doubled its market size to $450 million.
- Electric cookers were among the fastest-growing kitchen appliances in the fourth quarter of last year. Dollar sales were up 25 percent.
- Cookware, the largest housewares category, has grown more than 6 percent annually for the past three consecutive years.
- Refrigerators were most likely to be included in multi-item major home appliance orders, being chosen as the companion appliance two-thirds of the time. Major home appliance buyers spent an average of 8 percent more online during the week of Black Friday and Cyber Monday compared to the rest of the year.
Bed and Bath:
- Bedding brought in more than 60 percent of annual home textile sales, with Baby Boomers making over half of the home textile purchases. Millennials accounted for only 16 percent of sales.
- Nearly 42 percent of pillowcases and sheets purchased in 2016 were a solid color.
- Unit sales of bath linens grew 7.5 percnet with bath towel sets driving growth.
- Electric toothbrushes were the largest personal care category, growing three times the rate of total personal care.
Laundry:
- More than half of garment steamers were purchased by Millennials in 2016, which was double the amount bought by those aged 35-54.
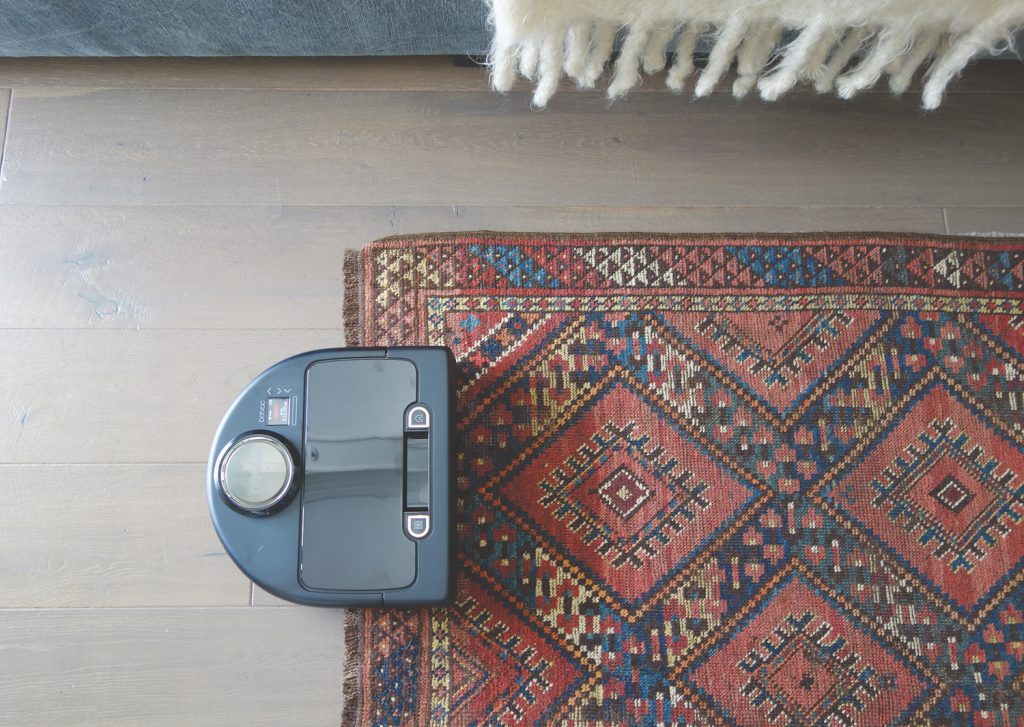
Cleaning Up:
- Robotic vacuums were the fastest growing floor care category, growing by 56 percent over the previous year.
Source: The NPD Group Retail Tracking Service